In this series of posts, I’ll explore conformal prediction, a topic that’s extremely hot at the moment. I’ve followed Christoph Molnar’s mini-course that you can find here but applying it to another data set that is more relevant to my research. Specifically, I’m applying it to the GEFCom2014 wind power forecasting data set. As a first step, I analysed the data set and checked for anomalies with the OpenOA library developed by NREL, you can find the notebook in which I analysed the data on GitHub.
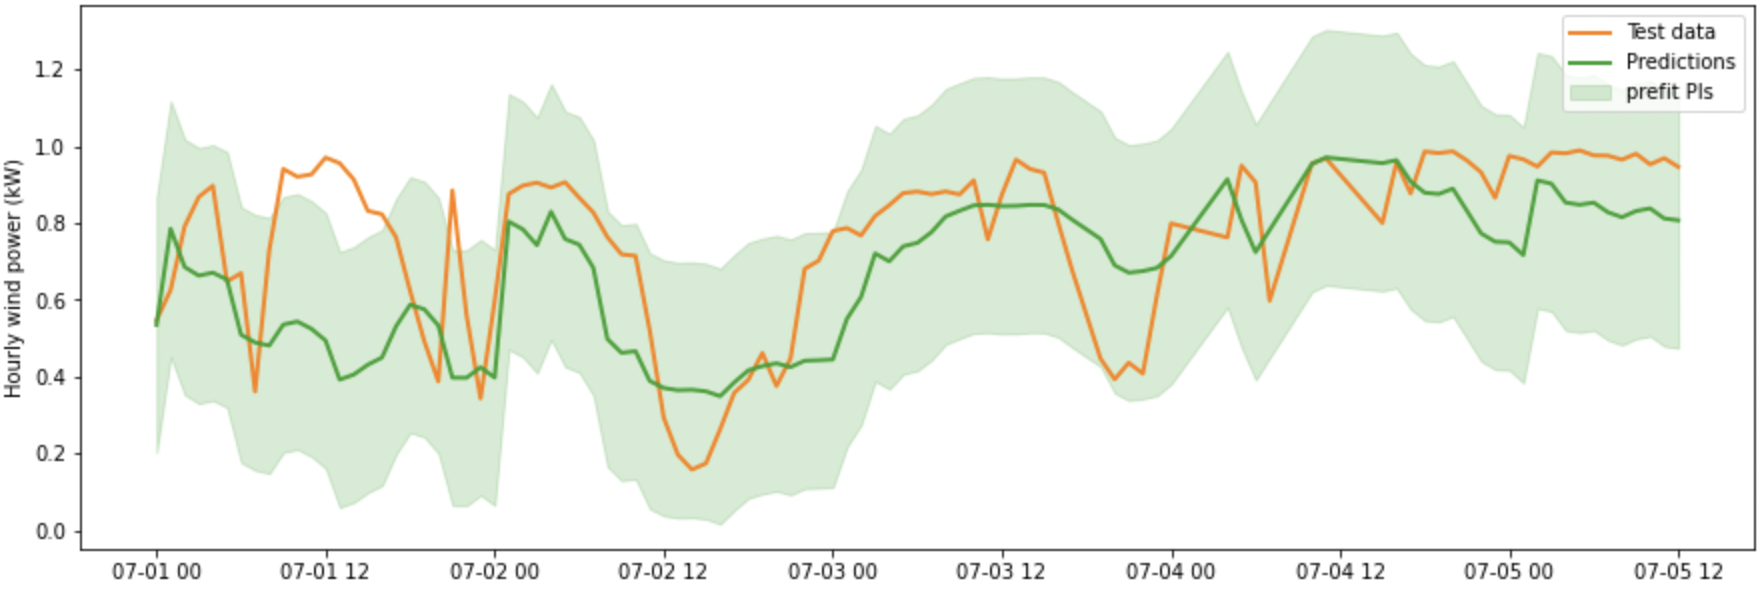
In this notebook, I use RandomForestRegressor to predict the mean wind power at 24 h ahead and use the MAPIE regressor to conformalise the predictions, i.e., to generate prediction intervals with 95% coverage. You can find the entire notebook here but I’ll again share a figure here to give you an idea of the result.

As you can see, the prediction intervals are not conditional. In other words, their width is constant. Also note that the prediction intervals go above 1, which is impossible since we’re dealing with normalised wind power. The next step is therefore to conformalised quantile regression, which, as far as I currently understand it, is capable of generating conditional prediction intervals. Stay tuned!