Blog | Dennis van der Meer
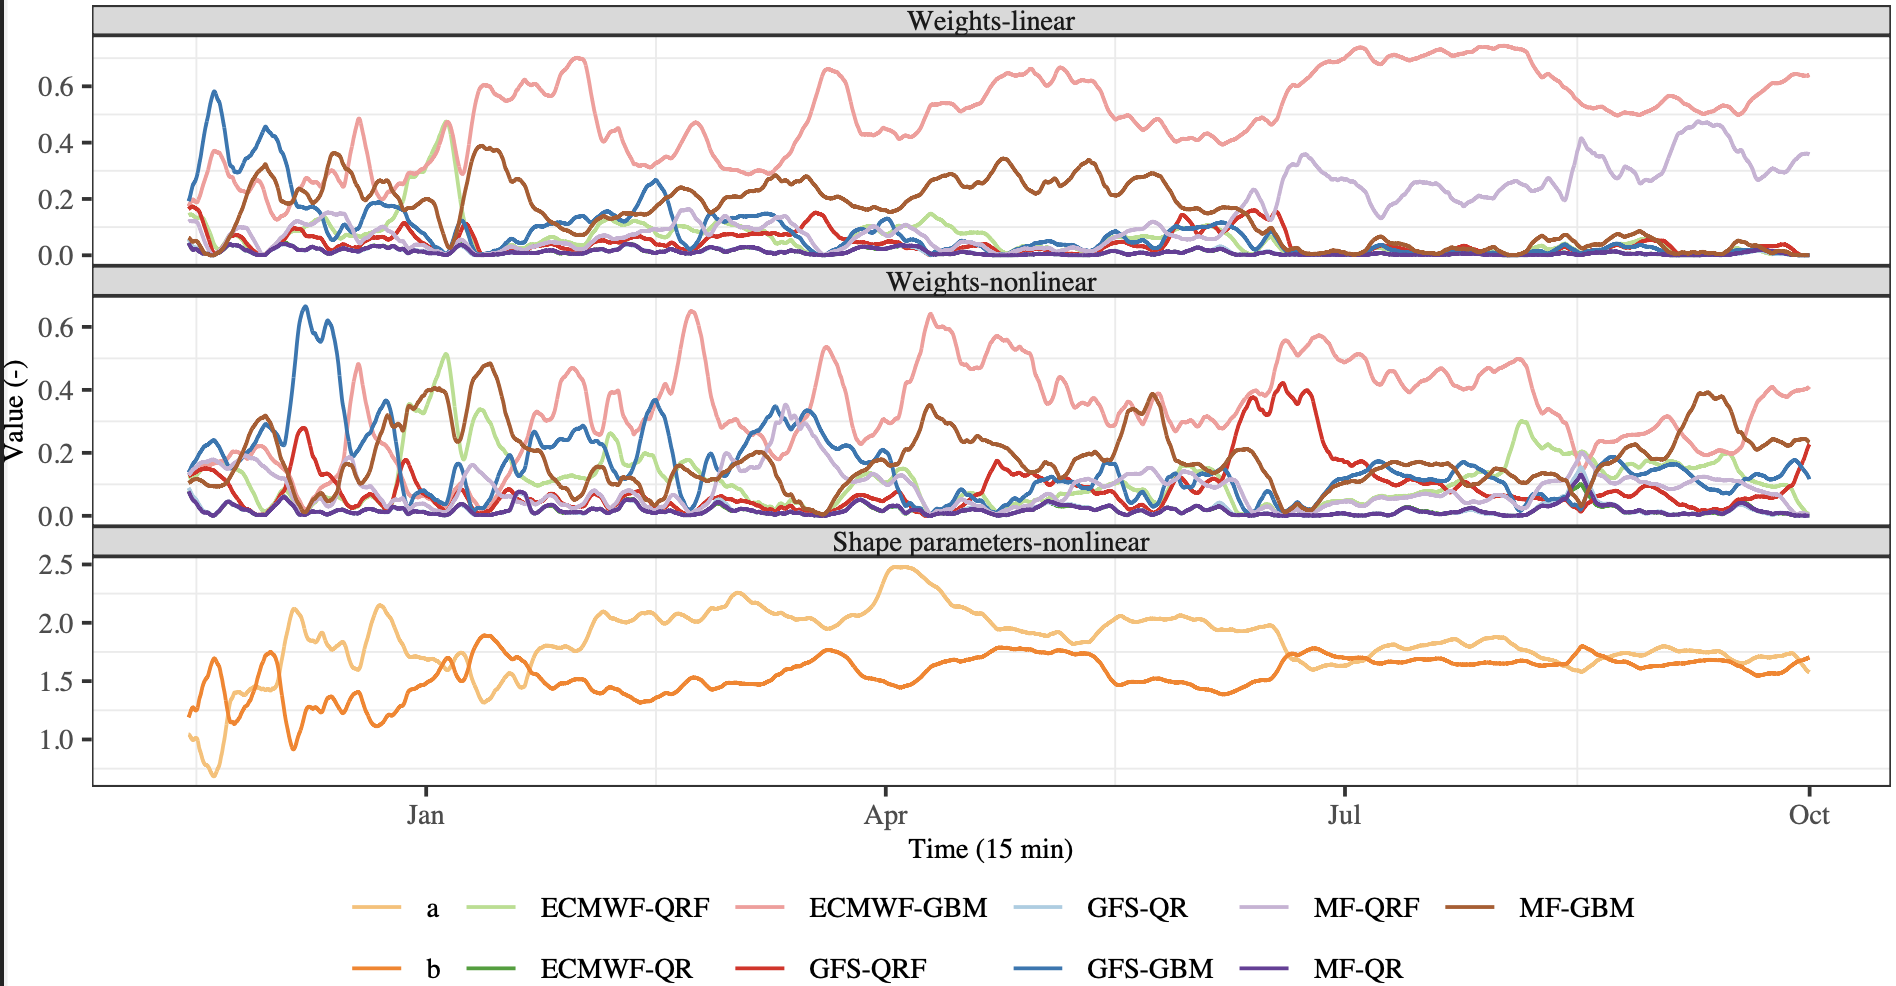
Forecast combination improves accuracy, but traditional linear methods often fall short due to increased dispersion and lack of dynamic adaptability. My latest paper introduces a solution: the online beta-transformed linear pool.
The Innovation
Linear forecast combinations can miscalibrate when component forecasts are neutrally dispersed. Our method, however, transforms probabilistic forecasts to maintain neutral dispersion and better calibration. The key advancement lies in the model’s ability to update combination weights online, adapting in real-time to changes in forecast accuracy.
Real-World Success
Tested on synthetic time series, our model’s performance converges to the optimal combination in hindsight. More notably, it outperforms the optimal hindsight combination when applied to nonstationary real-world data from a wind farm in mid-west France.
In essence, our online beta-transformed linear pool represents a significant leap forward in forecast combination, ensuring dynamic, real-time accuracy and robust calibration. You can find the find paper here.
In this series of posts, I’ll explore conformal prediction, a topic that’s extremely hot at the moment. I’ve followed Christoph Molnar’s mini-course that you can find here but applying it to another data set that is more relevant to my research. Specifically, I’m applying it to the GEFCom2014 wind power forecasting data set. As a first step, I analysed the data set and checked for anomalies with the OpenOA library developed by NREL, you can find the notebook in which I analysed the data on GitHub.
In this notebook, I use RandomForestRegressor to predict the mean wind power at 24 h ahead and use the MAPIE regressor to conformalise the predictions, i.e., to generate prediction intervals with 95% coverage. You can find the entire notebook here but I’ll again share a figure here to give you an idea of the result.
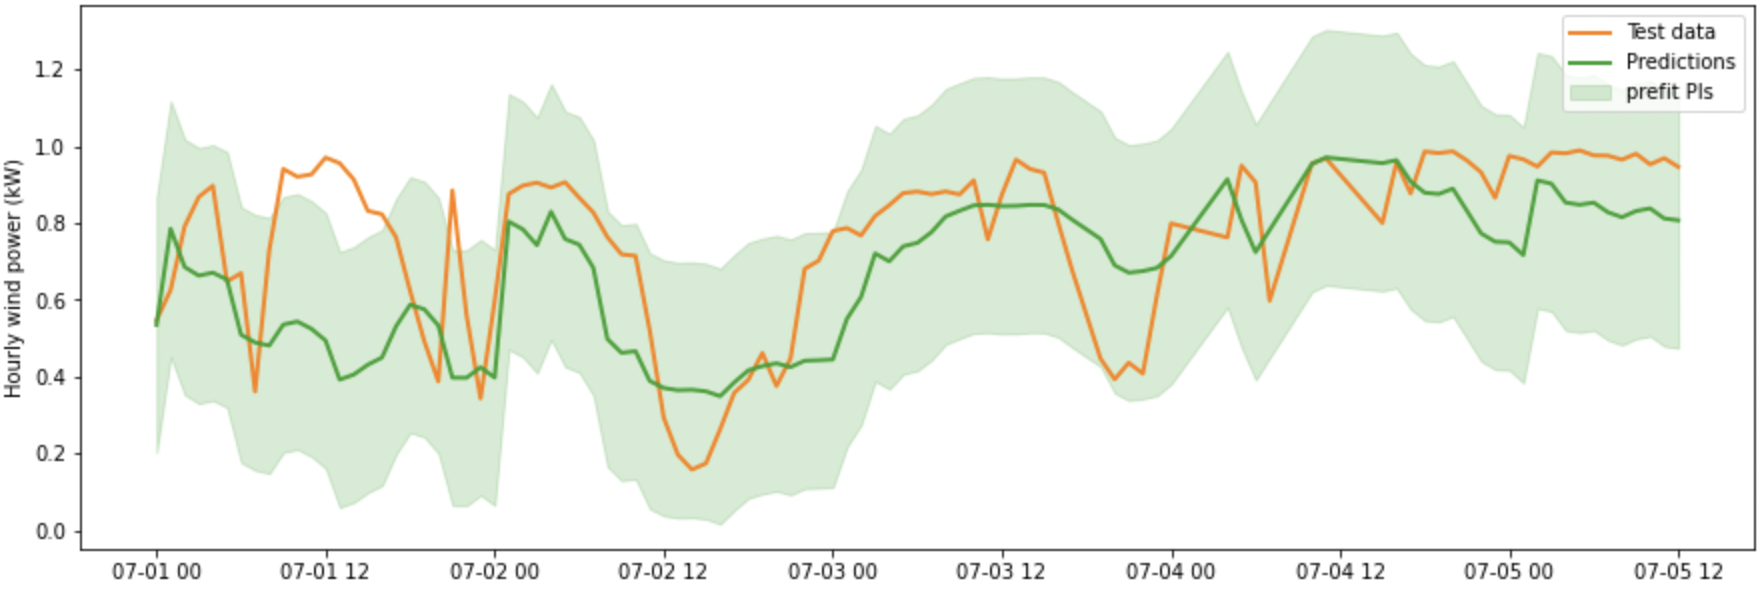
As you can see, the prediction intervals are not conditional. In other words, their width is constant. Also note that the prediction intervals go above 1, which is impossible since we’re dealing with normalised wind power. The next step is therefore to conformalised quantile regression, which, as far as I currently understand it, is capable of generating conditional prediction intervals. Stay tuned!
In this series of posts, I’ll explore conformal prediction, a topic that’s extremely hot at the moment. I’m following Christoph Molnar’s mini-course that you can find here but applying it to another data set that is more relevant to my research. Specifically, I’m applying it to the GEFCom2014 wind power forecasting data set. As a first step, the aim is to analyse the data set and check for anomalies with the OpenOA library developed by NREL. This is an extremely convenient library and I can definitely recommend it.
You can find the notebook in which I analyse the data on GitHub but I’ll share two figures here to give you an idea. Like I said, we want to check for anomalous data and one example of such data are those data points that are further from a bin’s median than a certain threshold. This is the so-called bin filter and you can see it in action below.
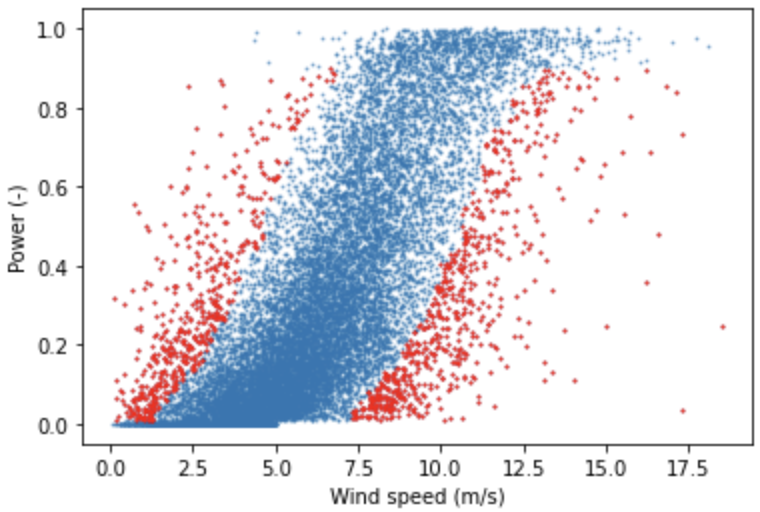
Removing anomalous data aims to improve the fitting of a power curve or machine learning models by increasing the signal to noise ratio. As a small extra step, I fitted some power curves to the cleaned data set, which you can see below.
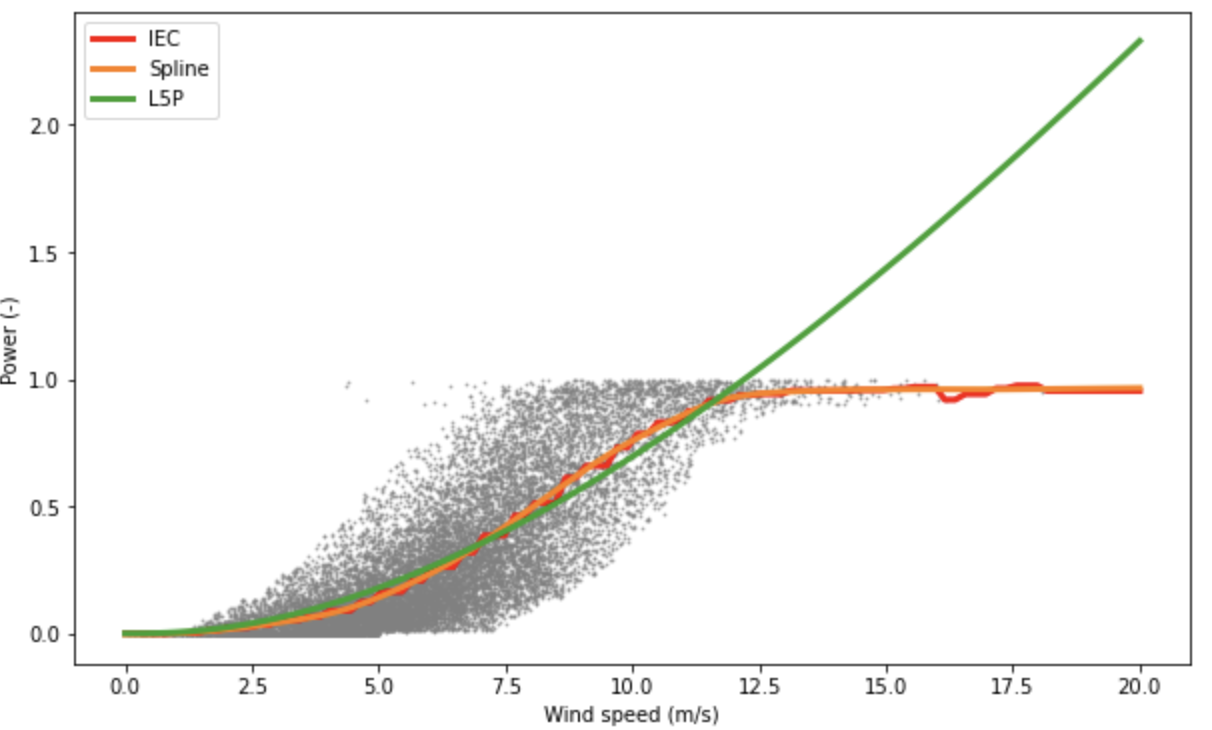
The next step is to train a machine learning model to generate conditional mean predictions and generate conformal prediction intervals. Stay tuned!
It’s well known that co-locating wind power and solar power plants makes economical sense because they can share an interconnection point and make more effective use of land. In this new study, led by Oskar Lindberg, we show that co-location has another benefit, namely improved forecast quality and value. Since the correlation between solar power and wind power is often close to zero or even negative, the combined signal tends to be smoother than the separate signals.
We show that for a case study in Varberg (Sweden), a ratio of about 50-60% wind power and the remainder solar power improves forecast quality the most. And this translates nicely into the added value in the day-ahead market by reducing the regulation costs because the deviations from the contracted energy production are lower!
The article, titled “Day-ahead probabilistic forecasting at a co-located wind and solar power park in Sweden: Trading and forecast verification” is open-access and can be here.
Feel free to reach out if you have any questions!
It’s been a while since last I posted something and I do intend to keep this blog alive. I’ve been applying to tenure track positions recently and this is quite time consuming.
Because of that, I’ve had to update my academic CV and I have now made this available here on my website. Go check it out if you’re interested! This will be regularly updated in case of, e.g., new teaching experience or new publications.
Stay tuned!
It’s been a while since last I posted something and I do intend to keep this blog alive. In my main research I’m now focussing on online convex optimisation, which I find very interesting. I might post a high-level introduction to the topic here soon.
In the meantime, I’ve been working on some codility exercises. These were, however, more challenging than anticipated! In any case, I’ll keep pushing with these exercises as well as the analysis on the La Haute Borne wind power data set.
Stay tuned!
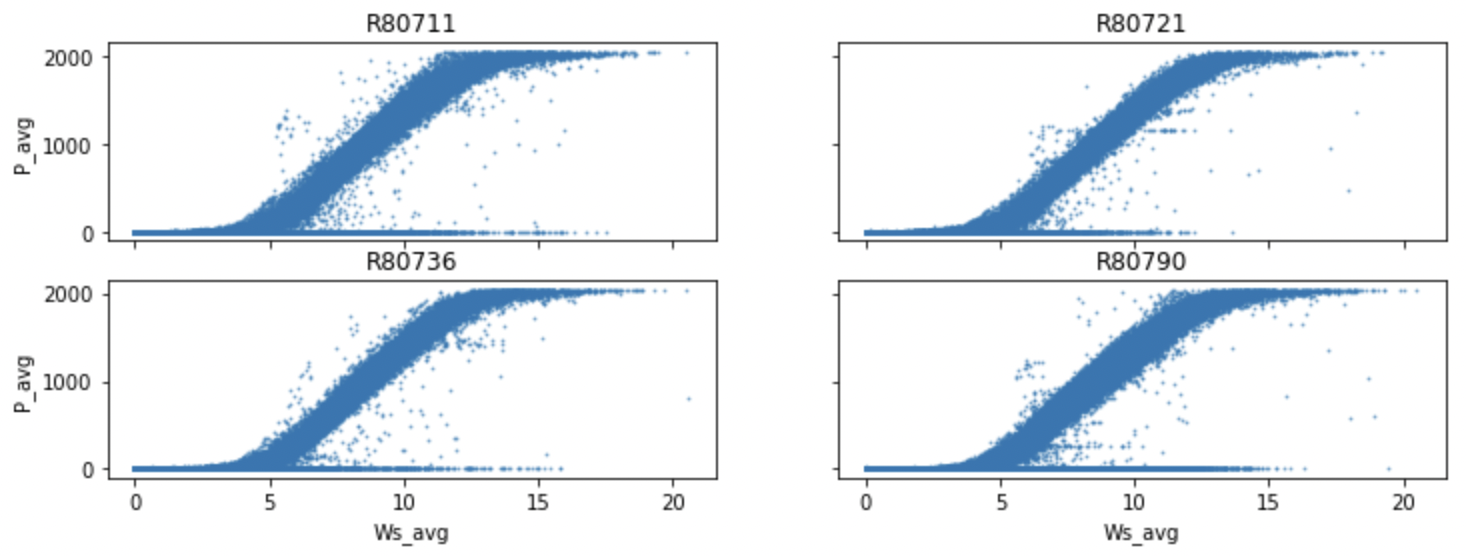
A minor update on the data analysis of the La Haute Borne wind power measurements, which is progressing slowly due to time constraints. In the figure, we can see the wind speed versus the wind power produced by the four different wind turbines. I’ve already removed negative power and power above the nominal capacity but anomalies remain (e.g., zero power production during nonzero wind speed conditions).
Next time I’ll try to impute or remove these critical instances. Stay tuned!
Today I noticed on ResearchGate that my publications have been cited exactly 1000 times! I’m very grateful that I’ve been able to contribute to the very exciting and quickly evolving field of probabilistic solar forecasting. And of course, it wouldn’t have been possible without all my collaborators. Thank you!
For my work, I mainly use R in combination with dplyr, which is an extremely useful library for data manipulation. However, since Python is nowadays one of the most common programming languages, I thought it’d be a good idea to improve my skills in this language. I’ve already talked about this in my first post on Codility.
The Codility exercises focus mainly on basic Python, whereas in my daily work I require other libraries as well. To that end, I’m going to work with the La Haute Borne wind power data with the overarching goal to produce calibrated probabilistic forecasts of the wind power. The first notebook will deal with importing, cleaning and preprocessing the raw power measurements.
When forecasting wind power more than a few hours into the future, it is important to include numerical weather prediction (NWP) forecasts that provide a future estimate of meteorological parameters such as wind speed. For that, we’ll use forecasts from the Global Forecast System (GFS) maintained by the National Centers for Environmental Prediction because they are open-source and a convenient API is available, which is addressed in the second notebook.
The final notebook will be dedicated to training, validating and testing a selection of forecast models on this real-world dataset!
Some information regarding the dataset and my first effort:
- Data for 2013-2016 can be downloaded from Engie. Since the raw dataset is quite large, the reader should download it for themselves.
- A description of the data features can be downloaded here.
- The static information, e.g., coordinates or rated power, of the wind farm can be downloaded here.
- I’ve already started working on the first task, i.e., importing, cleaning and preprocessing the data. The notebook can be found here (it’s still a work in progress though!).
Stay tuned!
As the title suggests, this is my first post! In this feed I’ll post updates on projects I’m working on, write short summaries of papers that I’ve (co-)authored or share my thoughts on topics that I know something about.
For instance, I’m currently improving my Python skills by starting from the absolute basics using Codility. Even though I’ve used Python in much more advanced applications, some lessons are actually quite challenging. Whenever I’ve completed a lesson, I’ll push the code to my GitHub.
You can find the code from today’s lesson here:
def solution(N, A):
    res = [0 for i in range(N)]
    for i in range(len(A)):
        if A[i] <= N:
            res[A[i]-1] = res[A[i]-1]+1
        elif A[i] == N+1:
            res = [max(res) for j in range(N)]
    return(res)
You’ll find this post in your _posts directory. Go ahead and edit it and re-build the site to see your changes. You can rebuild the site in many different ways, but the most common way is to run jekyll serve, which launches a web server and auto-regenerates your site when a file is updated.
Lorem ipsum dolor sit amet, consectetur adipiscing elit, sed do eiusmod tempor incididunt ut labore et dolore magna aliqua. Ut enim ad minim veniam, quis nostrud exercitation ullamco laboris nisi ut aliquip ex ea commodo consequat.
Curabitur pretium tincidunt lacus. Nulla gravida orci a odio. Nullam varius, turpis et commodo pharetra, est eros bibendum elit, nec luctus magna felis sollicitudin mauris. Integer in mauris eu nibh euismod gravida. Duis ac tellus et risus vulputate vehicula. Donec lobortis risus a elit.