In this series of posts, I’ll explore conformal prediction, a topic that’s extremely hot at the moment. I’m following Christoph Molnar’s mini-course that you can find here but applying it to another data set that is more relevant to my research. Specifically, I’m applying it to the GEFCom2014 wind power forecasting data set. As a first step, the aim is to analyse the data set and check for anomalies with the OpenOA library developed by NREL. This is an extremely convenient library and I can definitely recommend it.
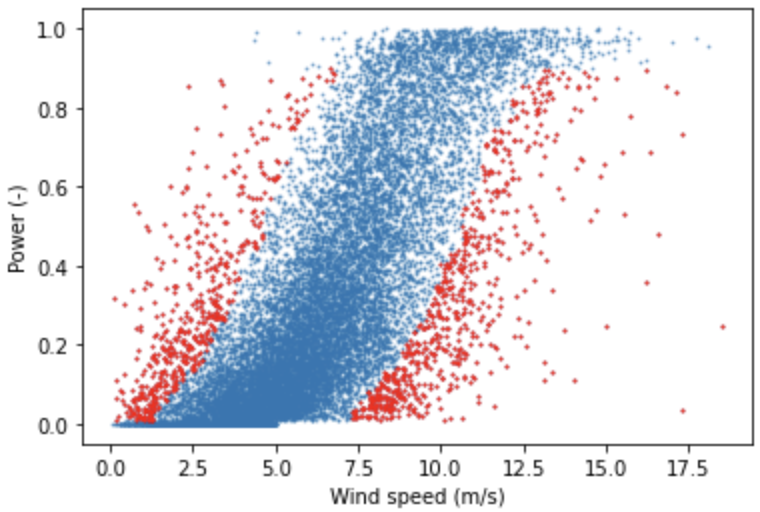
You can find the notebook in which I analyse the data on GitHub but I’ll share two figures here to give you an idea. Like I said, we want to check for anomalous data and one example of such data are those data points that are further from a bin’s median than a certain threshold. This is the so-called bin filter and you can see it in action below.

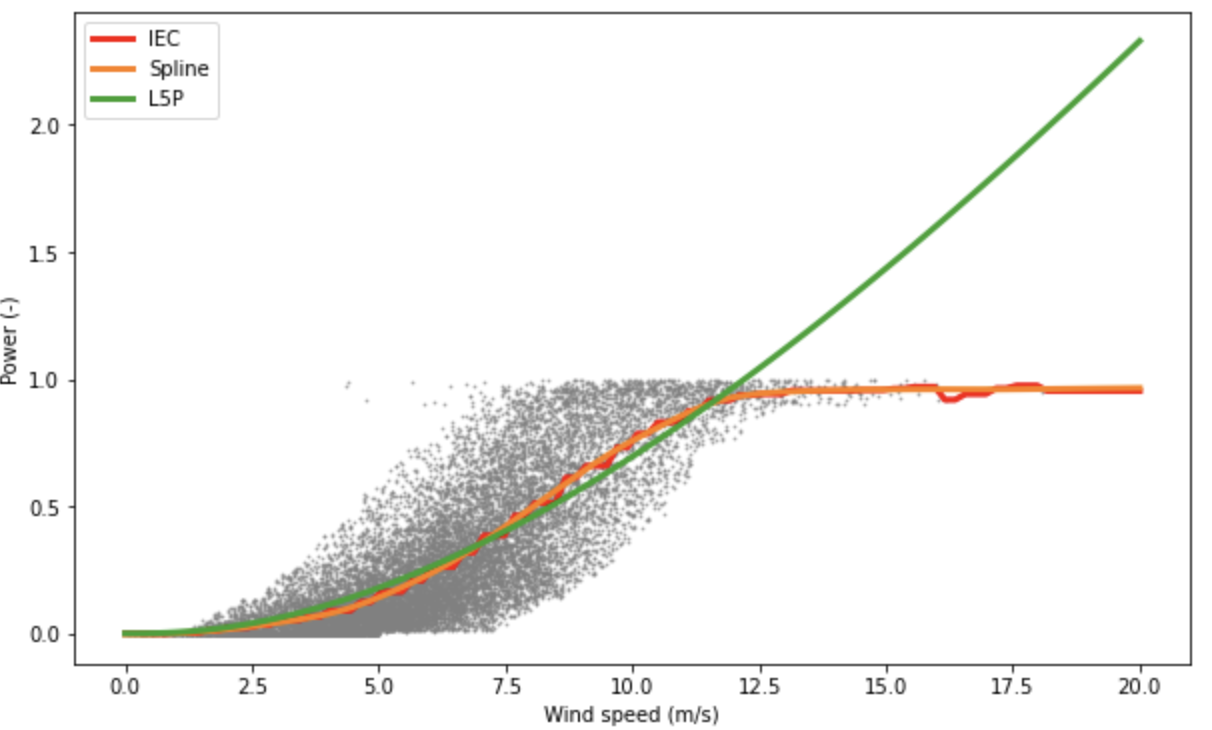
Removing anomalous data aims to improve the fitting of a power curve or machine learning models by increasing the signal to noise ratio. As a small extra step, I fitted some power curves to the cleaned data set, which you can see below.

The next step is to train a machine learning model to generate conditional mean predictions and generate conformal prediction intervals. Stay tuned!